The denominator compounds: asset returns relative to M2

Gold increased roughly 130-fold from its 1959 reference price to August 2026. Over the corresponding comparison window, U.S. M2 increased about 78-fold. Divide the two and gold’s gain becomes 1.66-fold, or about 0.76% annually relative to M2.
The S&P 500, with dividends reinvested, returned approximately 10.57% annually in nominal terms and 3.57% after the same M2 adjustment.
This is an analytical framework. M2 is broad money, not CPI and not the monetary base. CPI measures consumer prices. Dividing by M2 growth does not tell us how many goods an investment can buy.
The calculation
Adjusted CAGR = (1 + nominal CAGR) / (1 + M2 CAGR) − 1
For an illustrative asset growing 7% annually while M2 grows 6.7%, the adjusted CAGR is 0.281%. After 30 years, the asset grows 7.61-fold and M2 7.00-fold. Their ratio grows only 1.09-fold.
Subtracting 6.7% from 7% gives an approximation. The exact adjustment divides the difference by 1.067.
Historical results
Reference period for gold and equities: December 31, 1959–August 31, 2026.
| Asset | Nominal CAGR | M2-adjusted CAGR |
|---|---|---|
| Gold | 7.57% | 0.76% |
| S&P 500, dividends reinvested | 10.57% | 3.57% |
| M2 benchmark | 6.76% | 0.00% |
Gold’s starting $35.10 is a 1959 annual-average proxy, not a precise December close. Its early sample was constrained by Bretton Woods. Equities use NYU’s annual dividend-reinvestment series through 2025, extended with the S&P total-return index through August 2026. Returns exclude fees, taxes and implementation costs.
The full Fed M2 history starts earlier: $286.6 billion in January 1959, rising to $23,342.8 billion in August 2026. That is 81.45-fold growth, or 6.73% annually. The different starting month explains the difference from the 6.76% matched benchmark above.
Bitcoin’s quoted October 5, 2009 price was about $0.000764. Against a Coinbase spot quote of $83,677 at September 30, 2026, 21:26 UTC, its nominal inception CAGR is 197.38%. Using October 2009 M2 of $8,489.2 billion and the latest August 2026 reading gives 6.14% M2 growth and 180.18% adjusted Bitcoin CAGR.
September M2 was not yet available; that calculation carries August forward. An August 31 endpoint instead gives 197.83% nominal and 180.54% adjusted Bitcoin CAGR. These inception returns are dominated by the extremely low first quotation, which does not establish a scalable investment opportunity or a reasonable forward-return assumption.
For one common period—December 31, 2010–August 31, 2026—M2-adjusted CAGRs are gold 1.31%, S&P 500 total return 7.33%, and Bitcoin 108.38%.
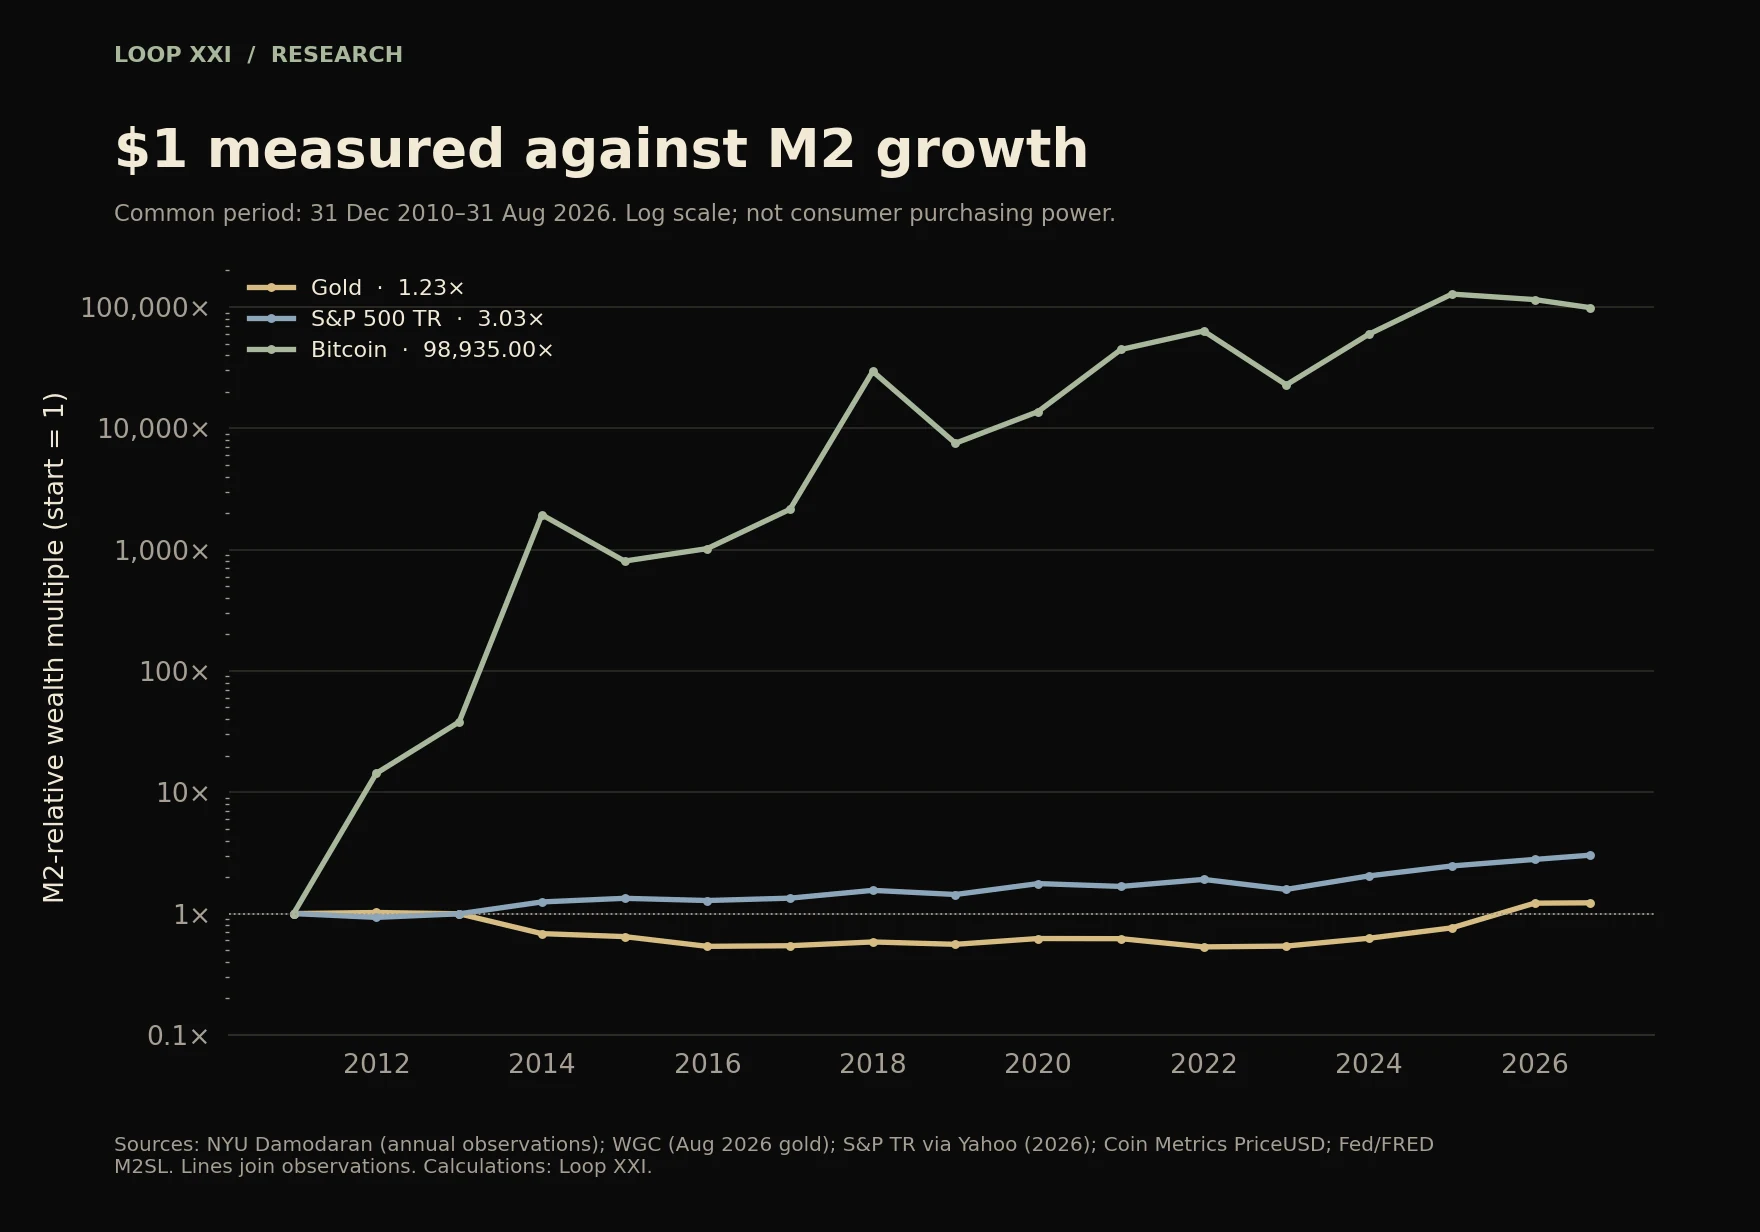
Annual observations hide intrayear drawdowns. Bitcoin’s historical return sample remains far shorter than the long gold and equity sample.
Bitcoin forward modeled returns
An equal-weight OLS regression of 5,918 daily Bitcoin USD prices from July 18, 2010 through September 29, 2026 gives:
log10(P) = −16.35647418 + 5.64308842 × log10(t)
P is USD per BTC; t is days since January 3, 2009. The 2009 quotation is excluded from this fit.
The fitted central trend is about $141,972 on September 30, versus the captured market quote of $83,677. Calling the trend a “median” assumes zero-median log errors; OLS alone estimates mean log price, not a validated future price distribution.
Assuming future M2 grows at its 6.727% full-history CAGR:
| Year-end | Modeled price | Trend→trend adjusted CAGR | Market→trend adjusted CAGR |
|---|---|---|---|
| 2030 | $477,300 | 24.62% | 41.11% |
| 2035 | $1.52m | 21.04% | 28.15% |
| 2040 | $3.96m | 18.34% | 22.81% |
| 2050 | $18.37m | 14.50% | 17.02% |
All modeled CAGRs start September 30, 2026. Market-to-trend returns incorporate assumed convergence from a below-trend starting price. Trend-to-trend returns isolate the fitted model’s growth and are the cleaner measure of its implications.
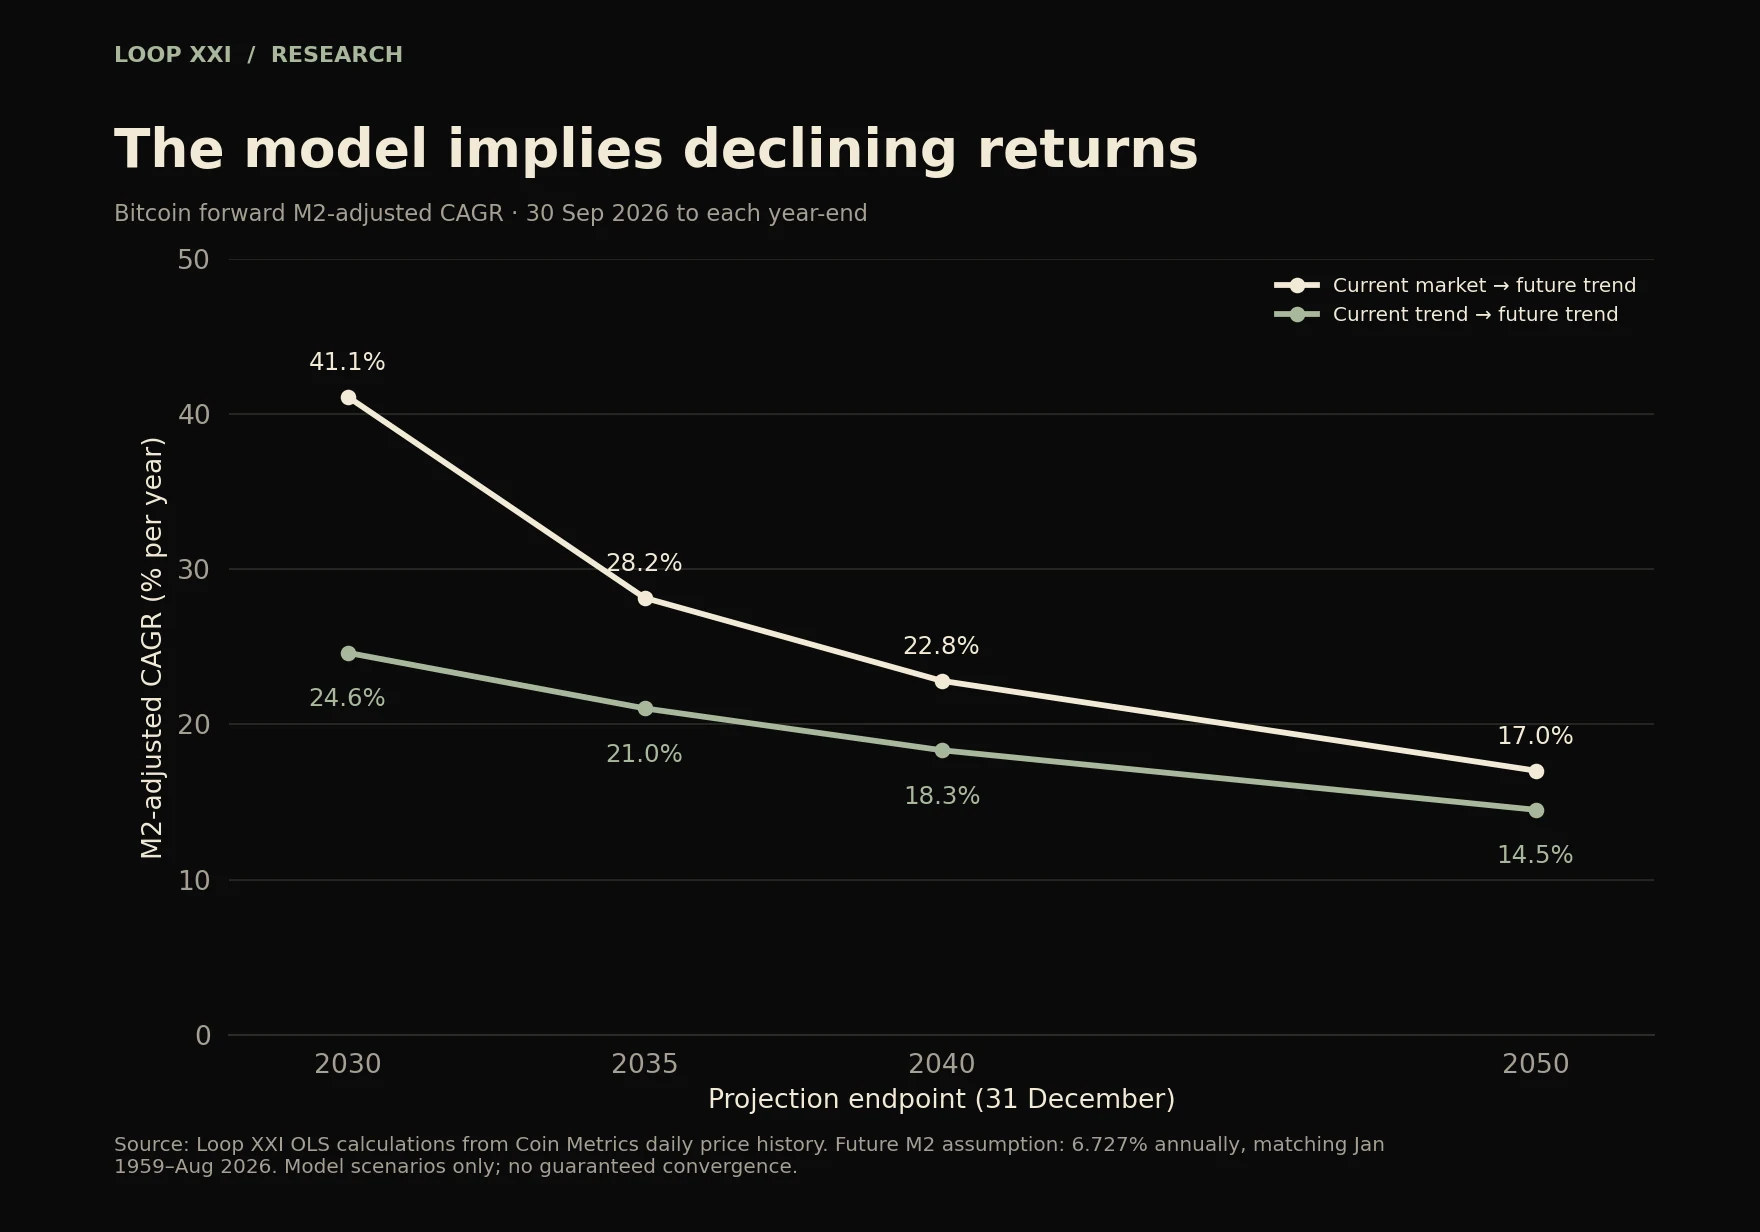
Under P = C × t^b, proportional growth is b/t: modeled percentage returns fall with elapsed time. A constant exponential CAGR is not the assumption.
The Bitcoin model is sensitive to its sample. Starting the fit in 2011, 2013 or 2015 rather than July 2010 produces modeled 2050 prices spanning roughly $11m–$23m. A strong historical fit does not validate such distant projections or guarantee convergence. Future M2 growth is uncertain as well.
What this means
A positive nominal return need not represent substantial compounding relative to money-supply growth. That is a mathematical observation, not a causal claim: earnings, productivity, rates, risk premia, demographics, regulation and liquidity also affect prices. M2 definitions and monetary regimes change.
For long-duration capital preservation, nominal, CPI-adjusted and monetary-relative performance are useful but different measurements. State the denominator, align dates and compound consistently. This research does not recommend an allocation or trade.
Sources: Federal Reserve/FRED M2SL; NYU historical returns; World Gold Council August endpoint; S&P total-return history; Coin Metrics; early price documentation; Coinbase quote.
Full analysis, source snapshots and calculation appendix: https://loopxxi.com/journal/asset-returns-adjusted-for-m2
Write a comment