The Only Asset That Fell

- The numbers, as they are
- Where the money went
- The cycle, measured four times
- What a drawdown is for
- Sentiment moved before the price did
- The case against this reading
- Thiers’ law needs a broken currency
- The wall behind all of it
- Where this explanation would break
- Sources and measurement
Bitcoin closed the week at $83,937. Twelve months earlier, on 13 October 2025, it traded at $115,061. Over the same twelve months the S&P 500 gained 19 percent, the Nasdaq 23 and gold 2. Of the four assets anyone bothers to compare it with, bitcoin is the only one that fell.
That is 27 percent lower. From its all-time high of $126,080 on 6 October 2025 it is down 33. And the fourth halving cycle, measured against the three that came before it, is the weakest on record in both directions.
The numbers, as they are
- Price: $83,937 (CoinGecko, 12 October 2026)
- 24 hours: +1.2%; 7 days: −2.7%; 30 days: +8.6%; 60 days: +31.4%
- Twelve months, 13 October 2025 to 12 October 2026: −27%
- All-time high: $126,080 on 6 October 2025, so −33%
- Lowest daily close of this cycle: $58,534 on 1 July 2026, so +43% since
- Market cap $1.69tn, 24-hour volume $19.9bn
- Total crypto market cap $2.84tn, bitcoin dominance 59.4%, stablecoins $283.9bn
- Fear & Greed 69, greed (it was 5, extreme fear, on 12 February)
- Altcoin Season Index 66, the highest reading of the year
Read the last two lines again. Sentiment has run from near-panic to greed, the smaller coins are outperforming, and the price is still a third below its high.
Where the money went
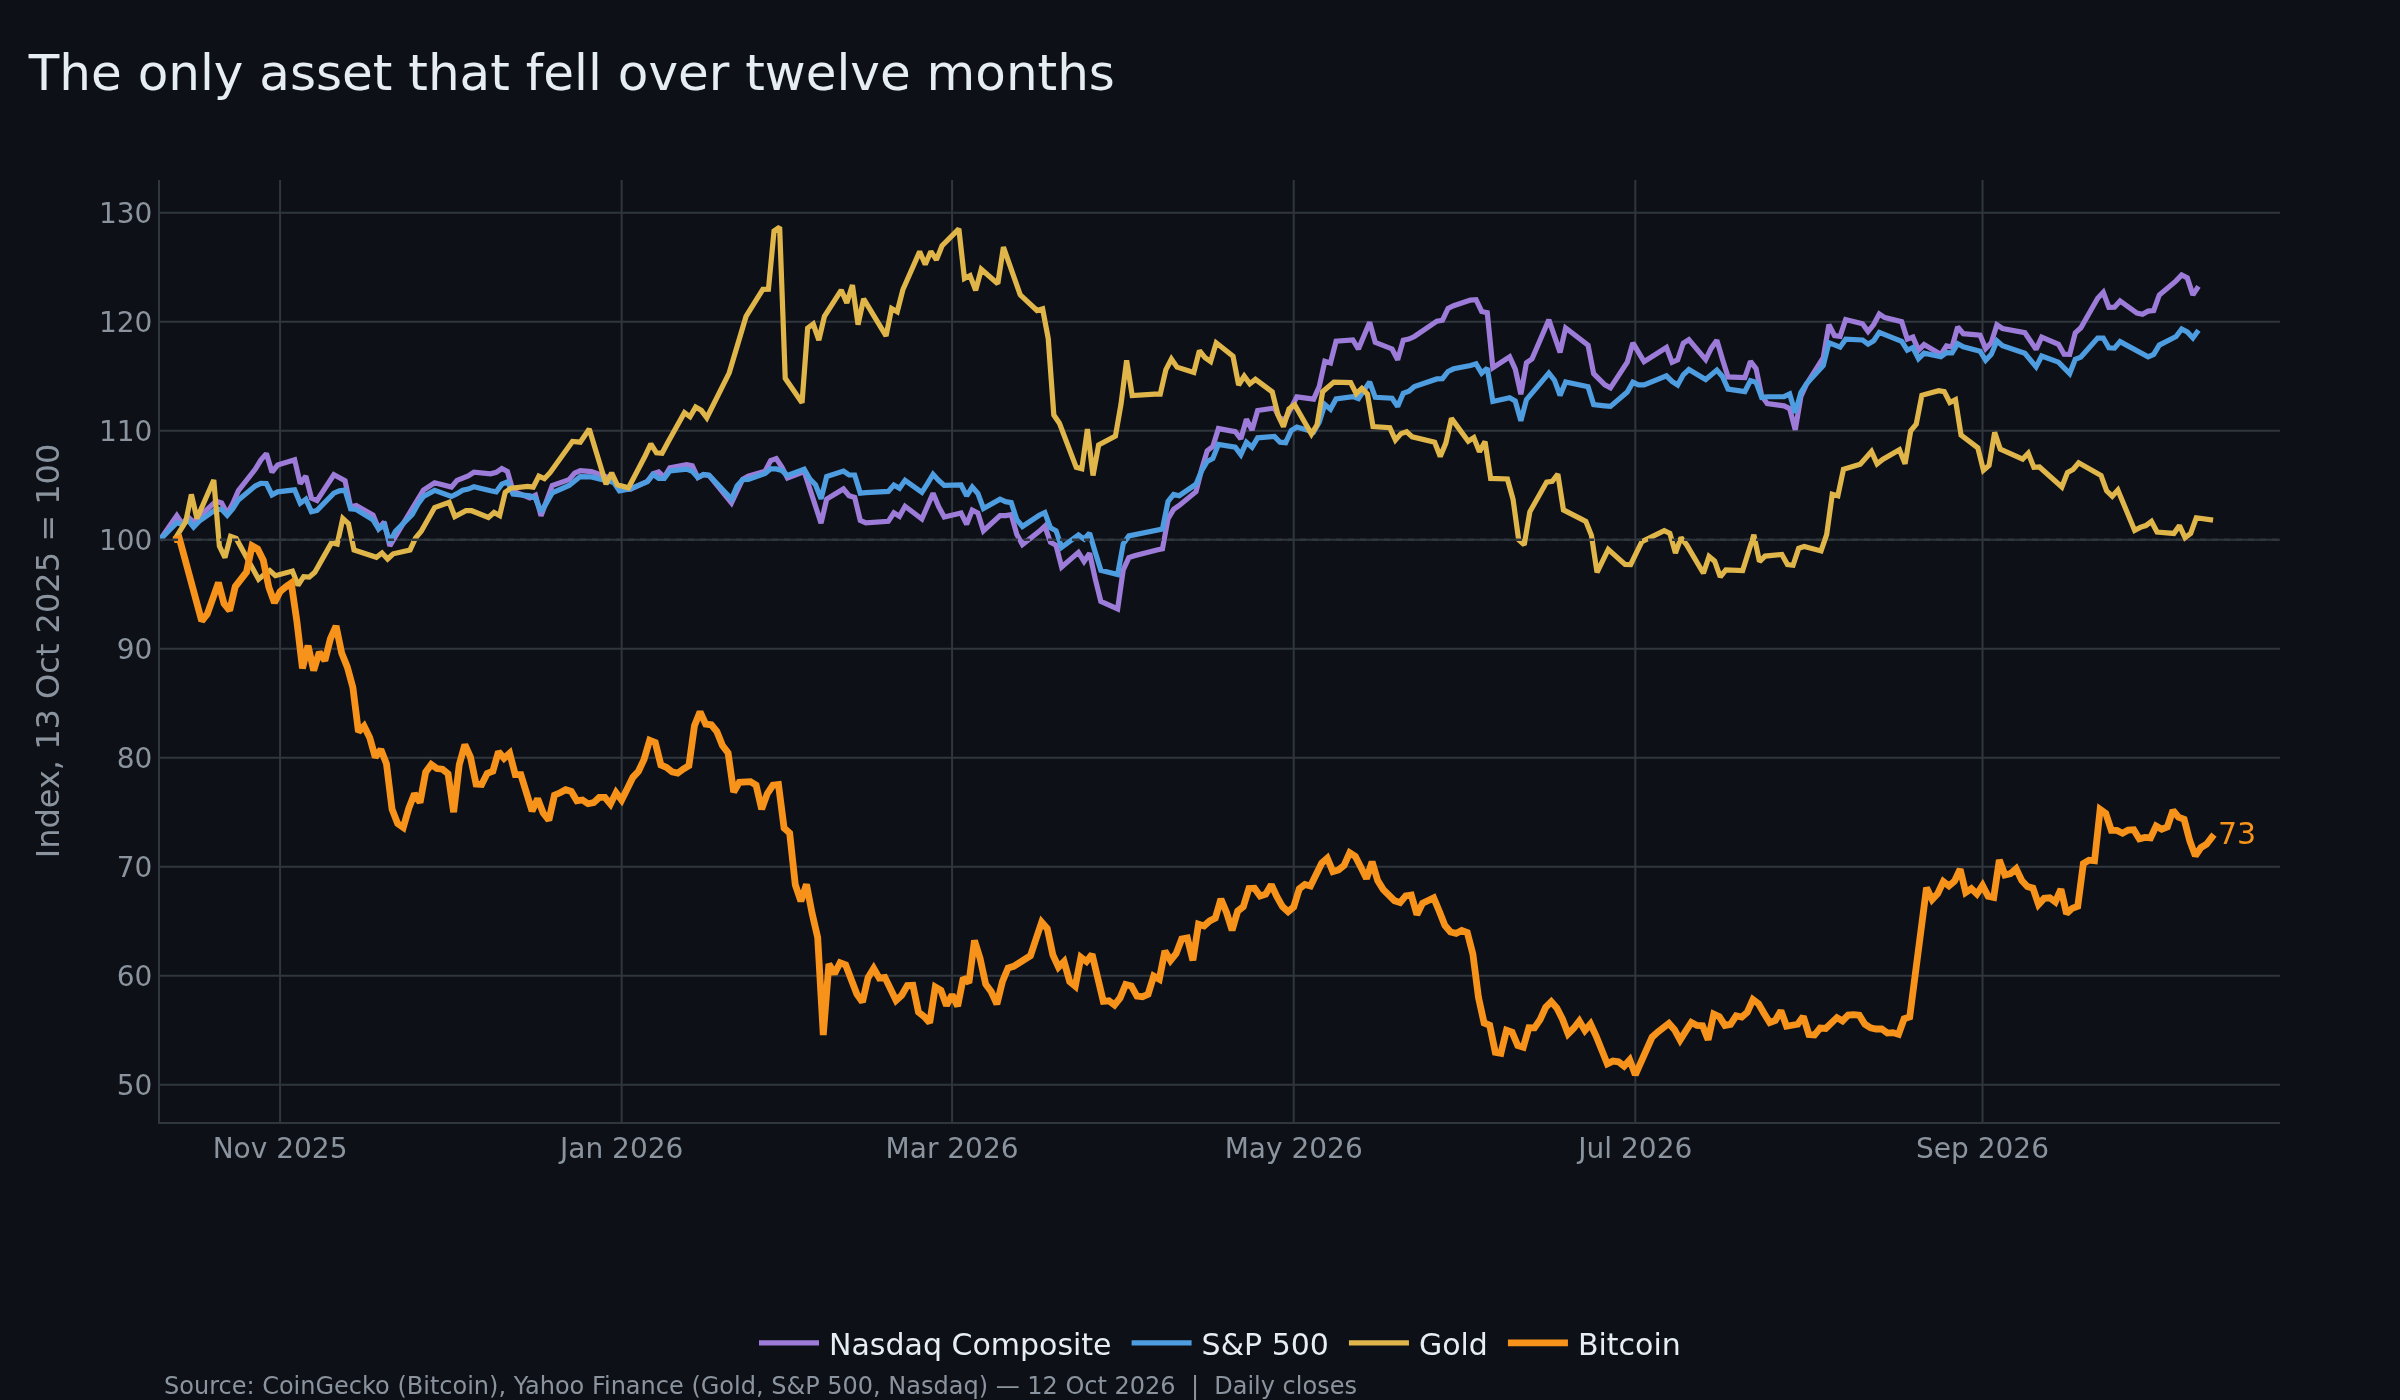
2026 has not been a bad year for assets. It has been a bad year for this asset.
The S&P 500 and the Nasdaq both closed at records on 6 October, six days ago. Gold is 2 percent above its level of a year ago, but the path there matters: it ran to $5,318 on 29 January, 29 percent higher, and handed back nearly three quarters of that spike. Even the metal that is supposed to be the trade of the decade spent nine months giving a run back.
Bitcoin has no coupon and no buyback. It has no earnings to discount and no central bank that is obliged to buy it for reserves. Its price is set by whoever wants it most at the margin. Every asset with a compulsory buyer (Treasuries held as bank collateral, equities supported by corporate repurchases, gold held by reserve managers) carries a structural bid underneath it. Bitcoin carries holders.
This is the Cantillon effect read from the other end. New money from deficit spending enters the system at specific points, and it lifts whatever sits at those points first. Over the past year that was equities, and for a few weeks in the winter it was gold. Bitcoin sat downstream of the pipe. That is not a statement about the asset. It is a description of the plumbing.
The cycle, measured four times
| Halving | Price at halving | Cycle top | Days later | Multiple | Cycle low | Days later | Fall |
|---|---|---|---|---|---|---|---|
| 28 Nov 2012 | $12 | 5 Dec 2013 | 372 | 91x | 15 Jan 2015 | 778 | −84.9% |
| 9 Jul 2016 | $663 | 17 Dec 2017 | 526 | 29x | 16 Dec 2018 | 890 | −83.2% |
| 11 May 2020 | $8,754 | 9 Nov 2021 | 547 | 7.7x | 22 Nov 2022 | 925 | −76.7% |
| 19 Apr 2024 | $63,508 | 7 Oct 2025 | 536 | 2.0x | 1 Jul 2026 | 803 | −53.1% |
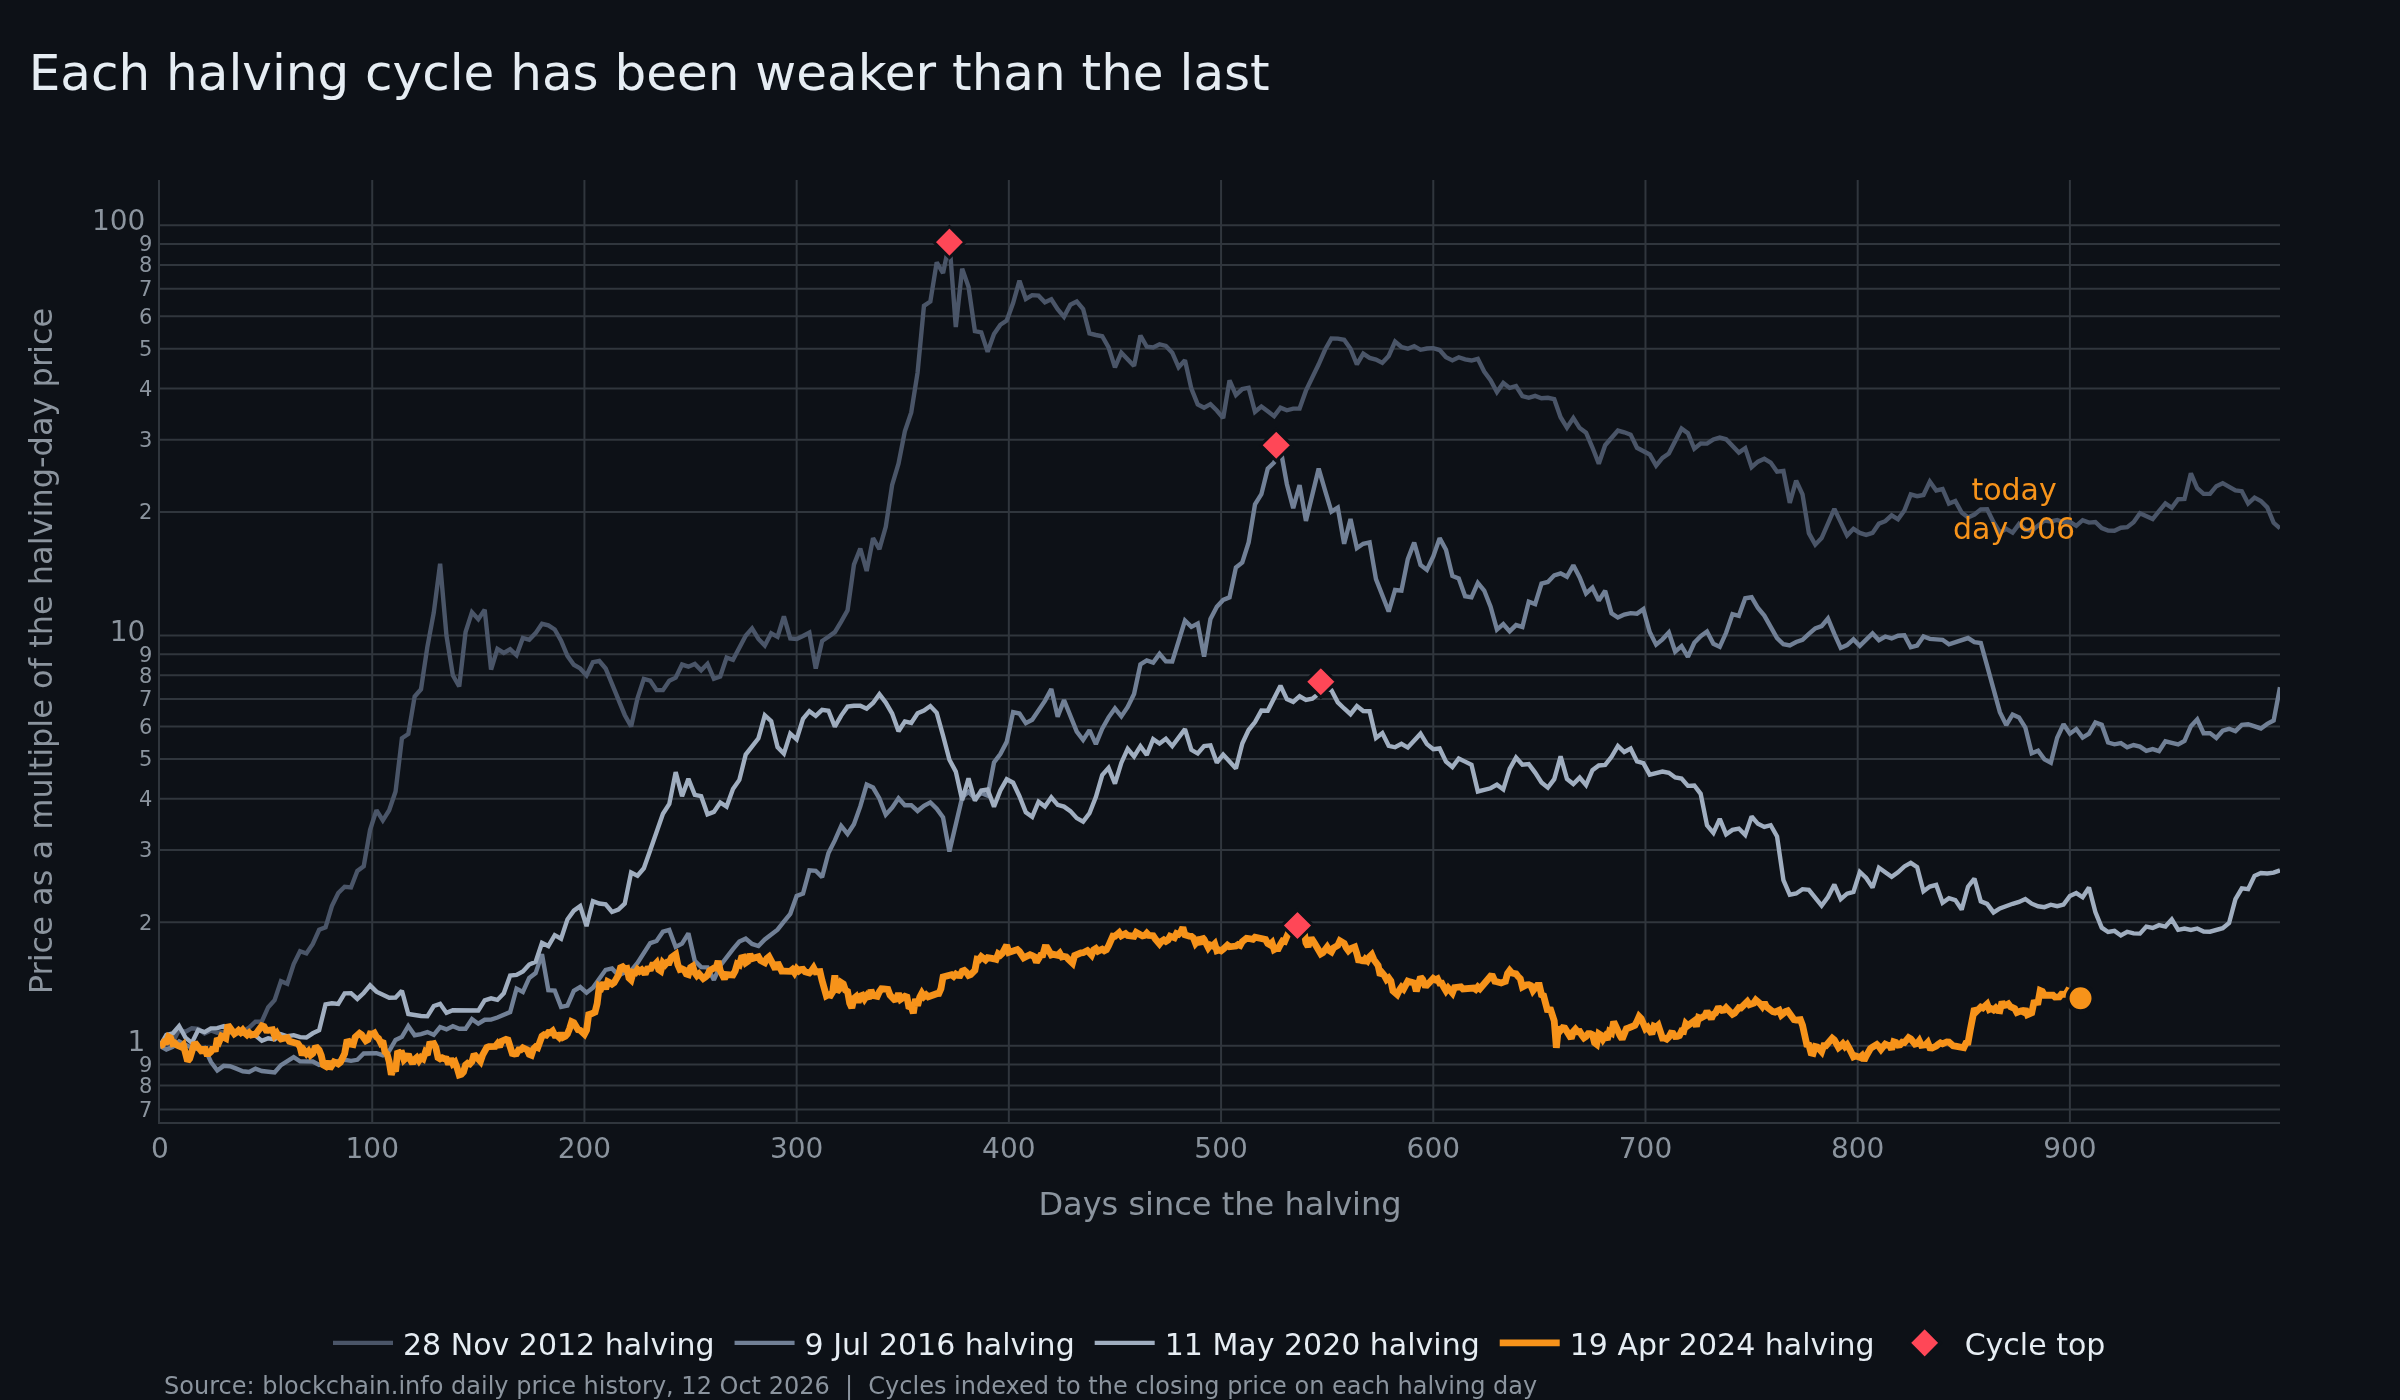
Every top landed between 372 and 547 days after its halving. One year to eighteen months, which is exactly the window the supply-shock story predicts. Bitcoin’s top arrived on day 536, in the middle of the range, with no help from anyone.
The other columns are more interesting. The peak multiple has fallen every cycle: 91 times, 29 times, 7.7 times, 2 times. So has the depth of the fall: 85, 83, 77, 53 percent. Both tails have shortened at the same time, and the liquidation itself has got faster: 406 days from top to bottom in 2013, 364 in 2017, 378 in 2021, 267 this time.
That is what a market looks like when it grows up. The same structure, less leverage inside it, fewer marginal speculators along for the ride.
What a drawdown is for
Austrian business cycle theory is blunt about what a fall is. A boom financed by credit has to be liquidated, and the liquidation is the cure rather than the disease. Suppress it and you get a larger boom on the same broken foundation.
In bitcoin the credit is visible, because it is explicit. Leverage on perpetual futures. Borrow-and-buy treasuries. A retail base that bought the trade because the trade was working. None of that survives a price that stops going up, and the July low at $58,534 is where it stopped.
The liquidation took 267 days, the shortest of the four. The 2015 low stood 85 percent below its cycle top; this one stood 53 percent below. In time-preference terms, the fall is a tax on the people who wanted the returns without the waiting, and the money that survived it belongs to people who did not need the price to rise this year.
Sentiment moved before the price did
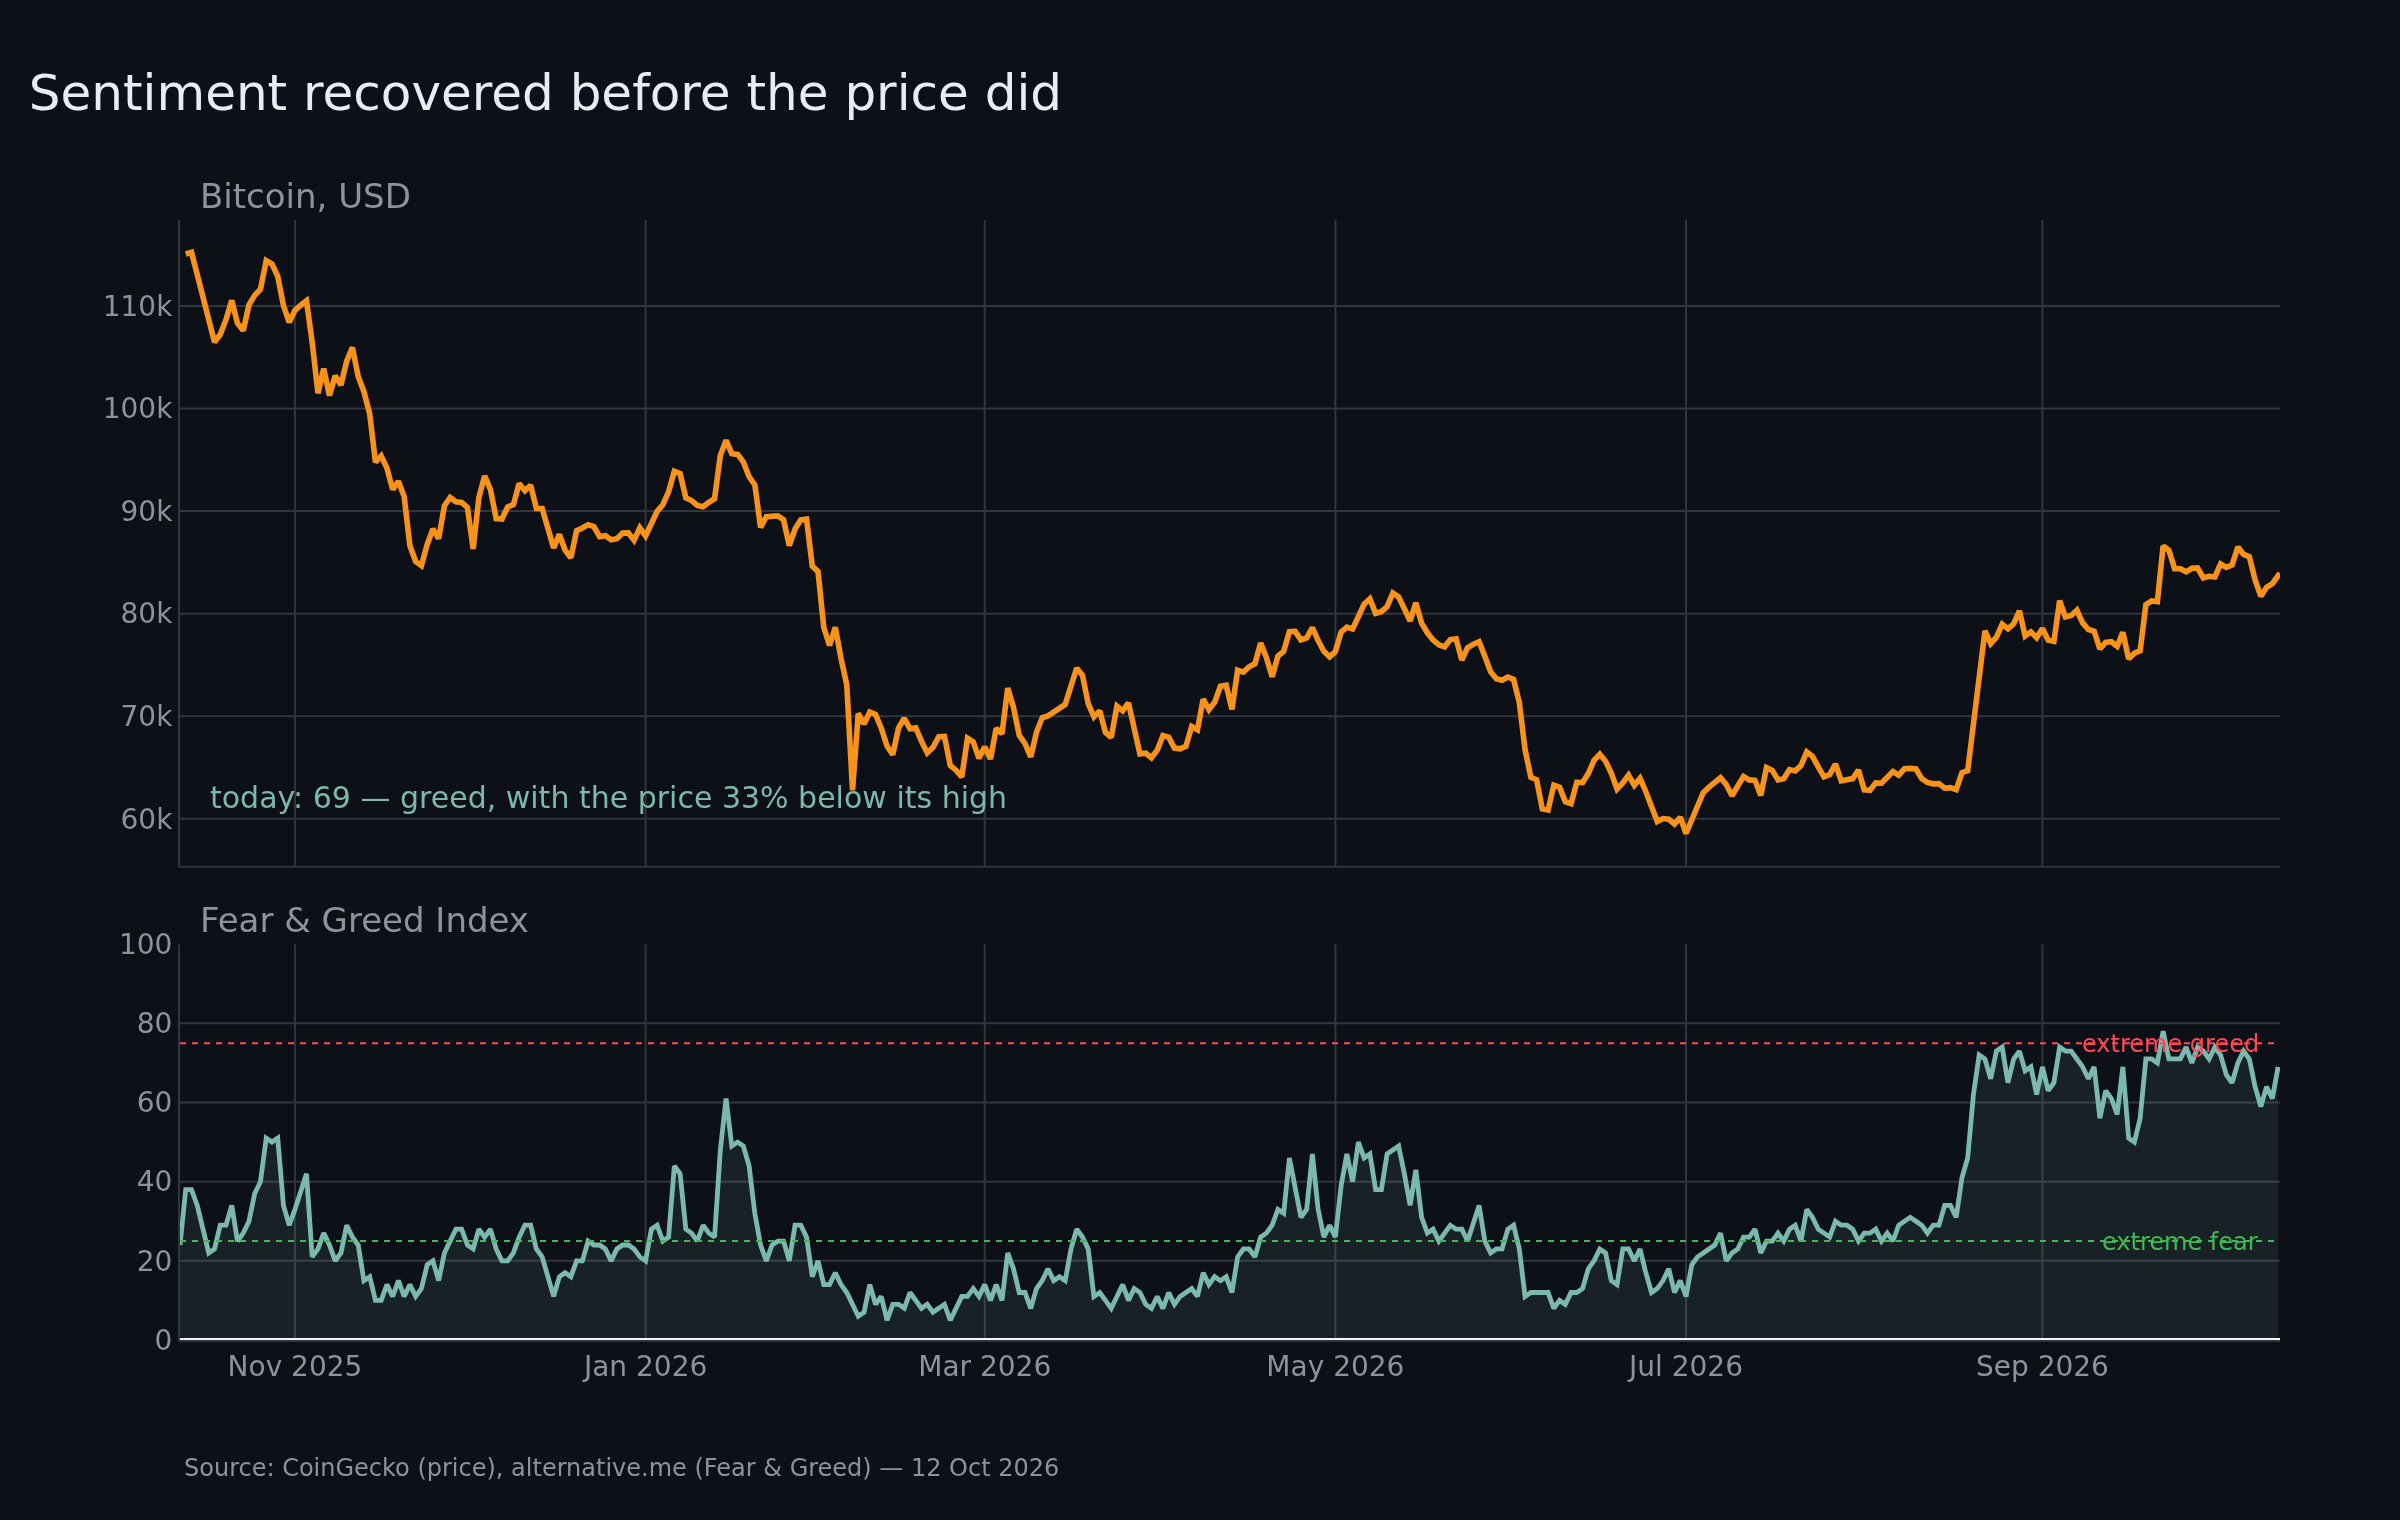
The Fear & Greed Index closed at 69 on Sunday. It bottomed at 5 on 12 February, with the price at $67,091.
The price bottomed later, on 1 July at $58,534 — four and a half months after the index did, at a lower price and a higher reading. Since then the index has climbed 64 points and the price has recovered 43 percent. It now sits in greed with bitcoin a third below its record. Sentiment leads nothing. It records what has already been sold, and it does so loudly.
The second number is the one to watch. The Altcoin Season Index is at 66, its highest reading of the year, having bottomed at 14 on 19 December 2025. That index measures whether the smaller coins are beating bitcoin, and right now they are. The money that came back into the market after July is choosing the faster horse.
That is rising time preference, and it is measurable. A market that reaches for the quick trade over the hard store is telling you what it expects from the next twelve months, and it is not patience.
The case against this reading
The strongest argument against this reading is that the cycle framing has quietly stopped applying. The four rows above would then be a coincidence of a market that was small enough to move on supply.
Gold is a $30tn market with a decades-long reserve bid behind it. Bitcoin is $1.7tn and nobody is obliged to hold any of it. The ETF era was supposed to institutionalise store-of-value demand. If that demand simply is not there at scale, then 2017 and 2021 tell us nothing about 2027. The honest comparison becomes every other asset that never came back.
The supply mechanics support that worry. The April 2024 halving cut new issuance to 3.125 bitcoin per block, roughly 164,000 coins a year, about 0.8 percent of the 20.1m already in circulation. Against $19.9bn of daily trading volume, the halving has become an arithmetic event. A theory built on supply shocks was always going to lose force as the flow shrank against the stock.
And there is the simplest version: with equities at records and Treasury bills averaging 3.87 percent, the marginal dollar has somewhere else to be. Bitcoin in a year when everything else works is a hard asset in the wrong half of the cycle.
Thiers’ law needs a broken currency
Austrians quote Thiers’ law — good money drives out bad — as though it operates everywhere and always. It does not. Gresham’s law describes what happens when a state fixes the exchange rate between two monies; Thiers’ law describes what happens when people can actually choose, and when the incumbent currency is failing.
That condition is met in Buenos Aires and Lagos. It is not met in the United States, where a ten-year Treasury still pays 5.242 percent and no one is forced to hold a bearer asset with no yield to escape anything. Western adoption is an allocation decision that takes years, not a flight that takes weeks. The recurring error in every bull case is importing the speed of a currency crisis into a country that is not having one.
The wall behind all of it
United States public debt stood at $40.3tn on 8 October, of which $32.5tn is held by the public (Treasury, Debt to the Penny). The average interest rate on marketable Treasury securities was 3.518 percent at the end of September. The ten-year yield on Friday was 5.242 percent.
Do that arithmetic slowly. Apply the 3.5 percent average to the whole $40.3tn and the interest bill is about $1.4tn a year. Apply today’s long rate to the same stock and it is over $2tn. The difference arrives without a single new law being passed.
A sovereign cannot pay a rate it never agreed to. It can inflate, repress, or default in real terms, and all three are the same transfer wearing different clothes. The Cantillon effect decides who receives the money first and who receives the price first. Bitcoin’s answer to that is structural: new coins go to whoever spends the energy, and there is no first-recipient class to bribe. That is the whole design, and it is also why it never gets the first bid in a liquidity wave.
Where this explanation would break
Three things would falsify it, and none of them is a prediction.
A new all-time high before the March 2028 halving would break the pattern outright. No cycle that had already made its top has ever done that.
Bitcoin dominance falling while the price falls would say this is a market being replaced rather than accumulated, and the cycle table would be describing a different asset than the one trading.
And a daily close below $58,534, the July low, would end the one column that has held for four cycles in a row: the shallower lows.
Everything above is measurement. The interpretation is mine, and it is the one that requires the fewest assumptions: same cycle, less amplitude, and a public that is greedy about a recovery it has not yet had.
Nothing here is a price target. The cycle is a pattern, not a promise, and the pattern is only as good as the last time it held.
Sources and measurement
Prices and market data: CoinGecko, 12 October 2026. Cycle history: blockchain.info daily closing prices, cycles indexed to the close on each halving day. Sentiment: alternative.me Fear & Greed. Altcoin Season Index, dominance and total market cap: CoinMarketCap public API, 12 October 2026. Debt: US Treasury Fiscal Data, Debt to the Penny (8 October 2026) and Average Interest Rates on US Treasury Securities (30 September 2026). Yields and gold: market quotes of 12 October 2026 (US ten-year 5.242 percent). Gold and equity series: Yahoo Finance daily closes, 13 October 2025 to 12 October 2026.
Write a comment