The Economics of Stagflation, Part I
The widely watched Michigan Index of Consumer Sentiment took a tumble last week. This came after a disappointing jobs report on Aug. 1, when Donald Trump decided the best policy move was to shoot the messenger by firing the head of the Bureau of Labor Statistics. It was a doubly self-defeating move: the bad news moved to the top headlines, as well as undermining the credibility of any future Trump-appointed replacement.
In any case, between signs of an economic slowdown and growing evidence that tariffs as well as deportations are pushing up prices, I’m definitely hearing more buzz about the possibility of stagflation — a term that, I recently learned, was coined in Britain in the 1960s. So this seems like a good time to write a primer about what stagflation is, how it affects people’s lives, why it is a particularly hard problem for policymakers to address — and why the risks of long-term stagflation, which we have avoided for many decades, are once again looking serious.
Beyond the paywall, I’ll address the following:
1. The stagflations that were — and the stagflations that weren’t
2. The logic of stagflation
3. Why Bidenomics didn’t cause stagflation
Part II, which will be posted next week, will turn to Trumponomics and address the question of whether it will inflict stagflation on the American economy. In addition I will present some thoughts on how to track the economy if, as seems all too likely, the current administration begins suppressing and distorting data it doesn’t like.
Stagflations that were, and stagflations that weren’t
In July 2021 Biden administration economists, observing that U.S. inflation was accelerating as the economy recovered from Covid, put out a remarkably prescient paper seeking to interpret that inflation surge in the light of history. The question on everyone’s mind was whether this bout of inflation would end with a “soft landing” or years of painful stagflation – a combination of persistent inflation and high unemployment. Their paper wasn’t perfectly prescient: The economists who wrote it clearly underestimated just how high inflation would go before peaking a year later. But four years later we can see that they got the basic answer right: the higher-than-normal inflation of the Biden years did ultimately end with a soft landing. By 2024, inflation had subsided, the economy was growing, and unemployment was historically low.
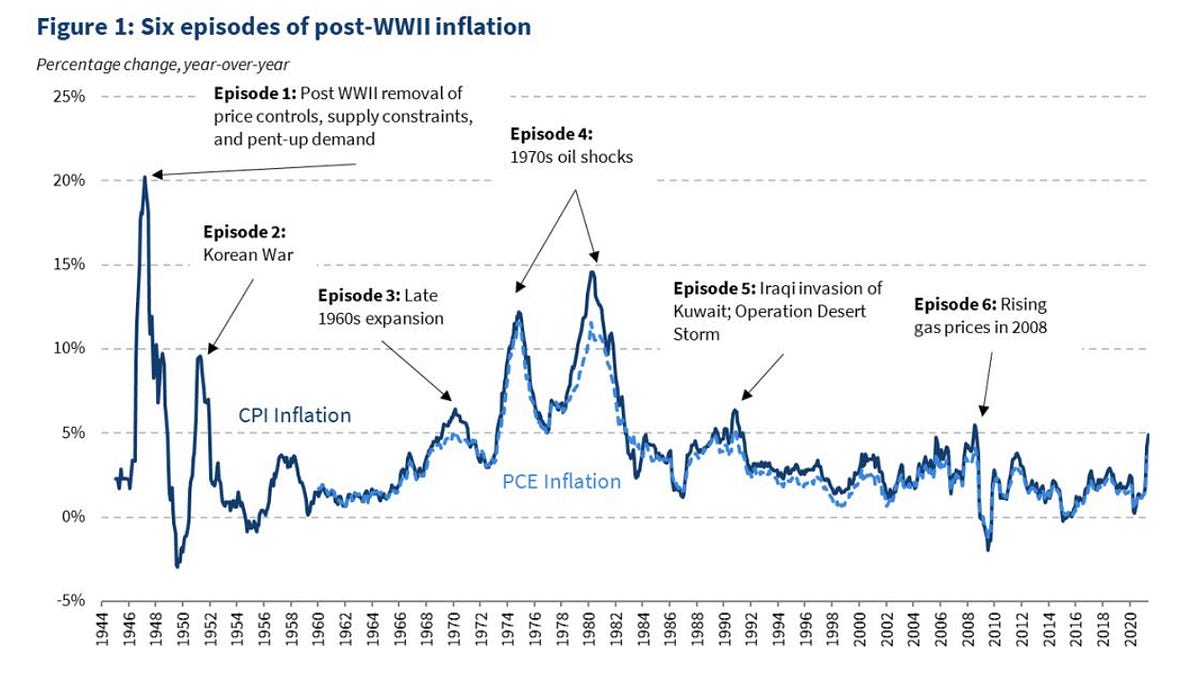
Here’s their historical figure:

Chart 1 Source: Council of Economic Advisers
Quick data wonk note: Chart 1 shows two measures of inflation, CPI (Consumer Price Index) and PCE (personal consumption expenditure). The differences between these measures are mind-numbingly technical and are usually insignificant. However, the Federal Reserve prefers PCE, so I’ll use it in most of the charts that follow.
Back to the analysis: for most Americans, the word “inflation” invokes memories of the 1970s — Episode 4 in the chart. This episode culminated in a period of not just inflation, but also high unemployment – that is, stagflation. Stagflation imposes considerable pain on consumers as they are squeezed both by lack of jobs and by rising prices. Understandably, there was considerable angst as to whether the 2021 post-Covid economy would fall into staglation.
The Biden White House economists argued, however, that the post-Covid period most closely resembled Episode 1 in the chart, and not Episode 4. Episode 1 corresponds to the post WWII period, a time of supply constraints (because it took time to convert back to a peacetime economy) combined with pent-up demand (with the end of wartime rationing.) Inflation surged after World War II, but the surge was temporary because — to use the Federal Reserve’s preferred language — inflation didn’t get “entrenched” in the economy. Therefore ending it *didn’t* require a bout of high unemployment.
Biden’s economists argued that the same would be true for the post-Covid inflation surge.
In 2021-22 there were also temporary supply constraints — remember those container ships steaming back and forth waiting for a chance to unload? — and pent-up demand as the nation emerged from Covid lockdown. Biden’s economists argued that once supply chains got unsnarled, inflation would fall without high unemployment, just as it did after World War II.
And they were right.
Chart 2 shows the two big disinflations of the post WWII era: The big drop in inflation during the first half of the 1980s (blue line) and the fall in inflation from its recent peak in 2022 (red line). The horizontal axis shows the unemployment rate. The vertical axis shows annual inflation as measured by the PCE. Data are quarterly for both measures.
s_!9NwG!,w_1456,c_limit,f_auto,q_auto:good,fl_progressive:steep/https%3A%2F%2Fsubstack-post-media.s3.amazonaws.com%2Fpublic%2Fimages%2F9d3c9d0c-6922-44f4-8bca-65720dd425ce_2038x1076.png)
Chart 2 Source: FRED
In late 1979 inflation was in double digits. The Chair of the Federal Reserve, Paul Volcker, decided to do whatever it took to bring inflation down. He succeeded, eventually bringing inflation down to around 4 percent, which was considered an acceptable level. (These days the Fed attempts to achieve an inflation target of only 2 percent.)
But as the blue line shows, the Volcker disinflation was extremely costly to the US economy, causing high unemployment for an extended period. The unemployment rate rose from 6% to nearly 11%. Although it eventually fell from 11%, it remained very high for a long time. As the blue line shows, it took 6 years for inflation to fall to the Fed’s target of 4%.
Fast forward to 2022, when inflation was once again high (although lower than in 1980). Many economists argued that getting inflation under control would once again require an extended period of high unemployment. In October 2022 economists surveyed by Bloomberg put the odds of a recession as the Fed tried to bring inflation down at 60 percent. Bloomberg’s own analysis put the odds at 100 percent.
But as I’ve recounted, Biden’s economists argued that the Volcker disinflation of the 80s was a bad model for the current situation. They weren’t alone. Some independent economists, like Goldman’s Jan Hatzius and, well, me argued that we could have a “soft landing” – that is, a large fall in inflation without a large rise in unemployment.
The red line in Chart 2 shows that the soft landing in action. Inflation fell rapidly, from around 7% to just above 2%, while unemployment increased only modestly, from about 3.5% to around 4.2%.
I’ll talk shortly about the underlying factors that made 2022-2024 so different from 1980-1984. First, however, we need to talk about why stagflation happens.
The logic of stagflation
Stagflation was one of the great intellectual triumphs of 20th-century economics.
If that sounds weird, let me clarify. I’m not giving economists credit for causing stagflation! The point, instead, is that economists developed a theory about how stagflation could happen before it actually happened. In effect, unpleasant as they were, real developments in the 1970s validated the methods of economic analysis.
There were two seminal economic analyses, both released in 1967, predicting stagflation. The most famous was by Milton Friedman, in his presidential address to the American Economic Association. However, I’ve always found the model laid out by Edmund S. Phelps a much more realistic (if far less readable) guide. What follows is a Phelps-style description of how stagflation can happen.
Imagine an economy in which there are a large number of firms that have some leeway in setting prices. That is, they aren’t like farmers who sell their crop for whatever the market price happens to be. Instead, they set prices based on their costs, the prices charged by competitors, and the strength of demand for their products.
However, they don’t like to change prices too often. Maybe they usually change their prices only once a year. It can seem perverse, but stagflation is only possible because prices are “sticky” and don’t change all the time.
Now suppose that policymakers have failed to cope with past inflation, so that this economy has been experiencing fairly high inflation, say 10 percent a year, for a long time. Then every time a seller resets its prices, it will in effect be playing leapfrog. That is, it will raise its prices partly to catch up with inflation since its last price reset, partly to get ahead of likely increases in costs and competitors’ prices until its next reset. Imagine a company that changes prices once a year. Other things being the same, it will probably raise its prices 10 percent at each reset — again, partly to catch up with inflation since it last raised prices, partly to get ahead of expected future inflation.
And everyone else will be doing the same. So 10 percent inflation will be self-sustaining, with everyone raising prices because everyone else is raising prices. Or to use the preferred language of Federal Reserve officials, inflation will have become “entrenched.”
What will it take to end this entrenched inflation? Unless you impose price controls — which raises a whole new set of problems — you basically have to impose a recession: raise interest rates, maybe slash government spending, so that almost every company’s sales are depressed. Faced with weak sales, companies won’t raise prices as much as they otherwise would have. Because everyone is doing this, inflation comes down, and once sellers realize that inflation has come down, they’ll raise prices even less on their next reset, so that inflation will gradually decline, until it’s eventually low enough to be acceptable.
But along the way you’ll have an economy in which most companies face weak demand, leading them to slash production and employment, even as inflation persists. So you’ll have both high inflation and high unemployment — stagflation.
If this story is correct, you’d expect to see inflation falling when unemployment is high, rising when unemployment is low. And that is what you see in data from the 1960s up until the late 1980s. The relationship is far from exact — this is economics, not physics — but it’s clear, and gets less messy if you make some adjustments to exclude volatile prices, adjust unemployment for underlying trends, and so on.
I won’t burden you with the statistical analysis. If you want to see the gory details, the best reference, in my view, is a paper published in 2022 (although it had been circulating as a working paper since 2020) by Jonothan Hazell, Juan Herreno, Emi Nakamura and Jon Steinsson. Nakamura, by the way, won the John Bates Clark medal for best U.S. economist under 40 in 2019, which is actually harder to get than a Nobel.
Nakamura et al document that the logic of stagflation, which worked from the 1960s until the late 1980s, stopped working thereafter. If you look back at Chart I, you’ll see that there were significant inflation spikes in 1990-91 (Kuwait) and again in 2008 (oil prices), but neither of them translated into anything resembling stagflation. And as we’ve seen, while many economists expected the really big inflation surge of 2021-22 to cause stagflation, it didn’t.
On the other side, if you extrapolated from pre-1990 experience, you would have expected the years of high unemployment after the global financial crisis to cause ever-falling inflation. They didn’t.
So something changed about the way inflation rises and falls. What was it?
Why Biden’s inflation didn’t turn into stagflation
Stagflation happens when high inflation becomes entrenched in the economy. That is, it happens when everyone keeps raising prices, even in the face of high unemployment, because they expect everyone else to keep raising prices.
The best available explanation for the disappearance of stagflation as a problem, according to Nakamura et al — a view widely shared by people at the Fed — is that by the 1990s we had transitioned from an economy in which high inflation was entrenched in expectations to one in which low inflation had become entrenched. In such a situation, firms are reluctant to raise prices because they believe that their competitors won’t; if they do, they will lose sales. By the 1990s, although occasional spikes of high inflation happened, as well as occasional recessions that in the past might have led to deflation, businesses believed that sooner or later the Fed would do whatever what was necessary to get inflation back to around 2 percent. And this belief in stable long-run inflation, based on the Fed’s demonstrated willingness to intervene to keep inflation under control, became a self-fulfilling prophecy.
A key chart in Nakamura et al compares actual inflation with one measure of expected future inflation – the average forecast by business economists who respond four times a year to the Survey of Professional Forecasters. These forecasts are a window into businesses’ expectations of future inflation.

Chart 3 Source: Nakamura et al
What Chart 3 shows is that in the 1980s expected inflation largely tracked recent changes in actual inflation. After that, however, and especially after 2000, expected inflation became insensitive to short-run fluctuations. Inflation might spike in the face of oil price shocks or slump in the face of recessions, but businesses basically said to themselves, “The Fed’s got this,” and continued to set prices in the belief that inflation would be around 2 percent going forward. And this belief became a self-fulfilling prophecy.
In 2021-22 we had a really big inflation shock — one that hit economies around the world. The main story was that consumer spending, which was depressed by Covid, came roaring back as vaccination spread and the pandemic subsided. But consumers spent their money differently post-Covid than before, buying fewer in-person services like restaurant meals and more physical goods like kitchen equipment. And it turned out that we didn’t have the infrastructure to handle the surge in demand for physical goods. There wasn’t enough capacity at container ports, there weren’t even enough shipping containers. So some prices spiked. And as I said, many economists jumped to the conclusion that it was the 1970s all over again.
But this inflation spike didn’t become entrenched. Instead, to use another piece of Federal Reserve jargon, expectations remained “anchored.” Chart 4 extends the Nakamura et al analysis through the Biden-era inflation shock:
s_!gQlf!,w_1456,c_limit,f_auto,q_auto:good,fl_progressive:steep/https%3A%2F%2Fsubstack-post-media.s3.amazonaws.com%2Fpublic%2Fimages%2Fcffde791-6e86-4731-bcd6-c0ec77ae4e37_1378x950.png)
Chart 4 Source: FRED and Survey of Professional Forecasters
Inflation soared for a while, but long-run inflation expectations barely budged. And as supply chains became unsnarled, inflation came back down without a whiff of 70s-type stagflation.
And if the 2024 election had gone the other way, that might have been the end of a relatively happy story.
But we got Trump, and with him a whole new set of radical policies. A huge jump in tariffs and mass deportations are an inflationary shock similar to the supply disruptions of 2021-22. Many economists expect that this inflation, like the past episode, will be transitory. But Trump has also attacked the independence of the Federal Reserve. If he succeeds, we won’t be able to assume that the Fed will do whatever it takes to get inflation back under control.
This means that there is now a much higher chance than there was a few years ago that inflation will become entrenched, and that we will once again face stagflation.
How large is that risk, and how might it play out? I’ll talk about these issues in next week’s primer.
Write a comment